We have the IT expertise to develop dynamic and interactive online interfaces to suit your needs, such as for collection of data, as can be seen in the CHARIOT STUDY; and even interactive cost-effectiveness models for your target audiences.


Online Interfaces


As shown in the figure below, an online Case Report Form has been built into this interface for collection of data from all participating sites. The use of online methodologies not only allows for increased convenience and efficiency in collection of data, but also enables randomization of sites and patients such that the sample data will be a more representative estimate of the population.


We developed a dynamic interface that allows results to be updated and analyzed after site patients have been entered into the study - the Control Site Report as shown in the figure below. Detailed reports were provided as to why patients' conditions were classified as controlled or uncontrolled asthma based on data collected from individual patients.


Cost-Effectiveness Modelling


Cost-effectiveness analysis is applied in situations where trade-offs exist, typically, greater benefit for an increased cost over an alternative therapy or strategic option versus usual care.  It is a systematic and quantitative method for summarizing health benefits and health resources of various treatment options into single numbers or ratios so that policy makers can choose among them. It also compares the costs and consequences of treatment alternatives where cost is measured in monetary terms and consequences are measured in natural units.  It is useful in situations where a new strategy (device, medication) is more costly but also appears to be more advantageous in terms of effectiveness, compliance, patient preference, etc.


The Coffee Model: To buy or not to buy


Here is a simple model of cost-effectiveness analysis using a decision tree generated by TreeAge™ software. By using an everyday example of coffee, this decision tree illustrates how these models would effectively translate the cost savings of your product (i.e. cost-effectiveness) to your target audience in an effective and easy-to-understand manner.
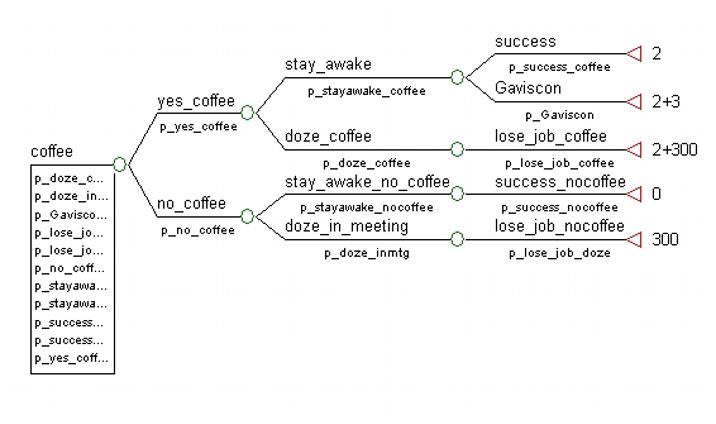
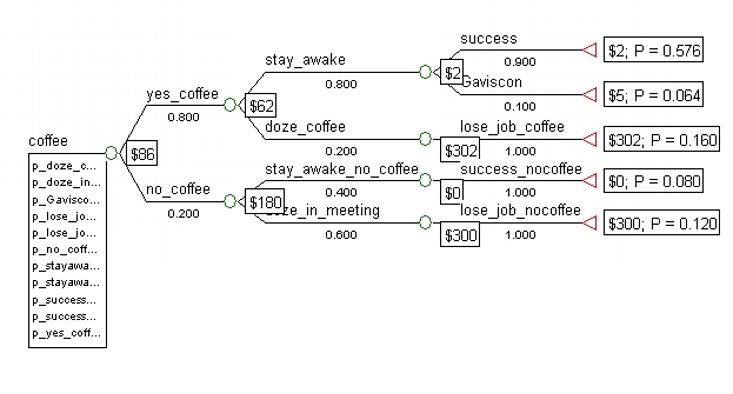
As can be seen from the Figure above, each node represents a point of uncertainty- where we will explore the different health outcomes of treatments and attach monetary values and probabilities to each outcome.

In this case, the different consequences of consumption of coffee on your job , specifically, is explored in a simplified, yet interesting and novel way.

When deciding whether to drink a $2 cup of coffee, you consider if it helps keep you awake. Let's say you're successful in your job by staying awake with the help of coffee. The cost involved is only $2. However, should you develop heartburn from over-consumption of coffee and require Gaviscon- you then incur a total cost of $5 to stay awake on the job.

If you drank coffee but still dozed off... you lose your job and incur a cost of $300 to place an ad in the New York Times ($302 if you throw in the cuppa coffee).

On the contrary, if you managed to successfully get work done without coffee, you don't incur any costs. However, if not having any coffee makes you doze off in a meeting with your boss, you lose your job.
Cost of:
 Cost (Amount in USD)
Coffee
$2
Gaviscon from heartburn due
to over-consumption of Coffee
$3
Losing job $300

The costs of each node is calculated with the respective conditional probabilities and values of outcomes (monetary, QALY) for analysis. It is now evident that when all consequences of the available choices are considered, drinking coffee would reduce the costs by nearly a third; and your decision should now be pretty clear!
Sensitivity Analysis


In all analyses, there is uncertainty about the accuracy of the results that may be dealt with via sensitivity analyses.  In these analyses, one essentially asks the question "What if?" 

Sensitivity analyses allow one to vary key values over clinically feasible ranges to determine whether the decision remains the same, that is, if the strategy initially found to be less costly or more cost-effective remains the dominant strategy.  By performing sensitivity analyses, one can increase the level of confidence in the conclusions.  Sensitivity analyses also allow one to determine threshold values for these key parameters at which the decision would change. 


Model Interactivity


We are able to create cost-effectiveness models that allow for interactivity. It allows for dynamic changes to be made to associated figures, granting flexibility and enhanced presentation to your models.